Getty Images
The Penguins are set for a potential mass exodus via free agency, with only seven forwards and five defensemen who saw significant time at the NHL level under contract going into next season. Fortunately for the Penguins, the majority of the holes are in the bottom six. New general manager Jim Rutherford addressed the depth during his introductory press conference, stating:
” …that our supporting cast has to be improved. I look at our fourth line players and some of those guys are in double-digit minuses. You can’t have that. You have to have energy on your fourth line, you have to have penalty killers, and you certainly have to have guys that are capable of playing defensively and not costing you that much on goals against.”
While plus/minus isn’t the best evaluation tool, no one will dispute the fact that the Penguins need to upgrade their bottom six. This offseason offers a great opportunity to do that, offering a blank slate for the new front office to work with. That being said, the front office will have to decide who, if any, of the pending free agents are worth keeping.
Forwards–7 UFA, 1 RFA
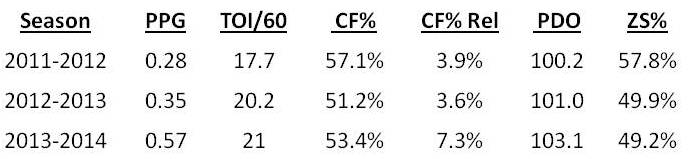
Brandon Sutter(RFA)–The Penguins only have one restricted free agent, but its a big one. Sutter has been the team’s third line center for the past two seasons after coming over as one of the key pieces in the Jordan Staal trade. Predictably, Sutter has been a downgrade from Staal; however, the drop has been more dramatic than many Penguins fans had hoped:
*Data from ExtraSkater.com
Sutter has put up some pretty rough numbers both from a possession and goals perspective. To be fair, he has been saddled with very difficult zone starts and some bad players (he spent more time with Tanner Glass than any other forward this year) but there isn’t much evidence, statistically or otherwise, that Sutter is anything more than an interchangeable third line center. Sutter does have some things going for him, most notably strong skating ability and a good shot. The problem with Sutter has been an inability to convert those tools into consistent production at either end of the ice, at least at even strength. At 25, it isn’t unreasonable to expect some improvement as he enters his prime over the next two years, but that chance isn’t worth paying a premium for. If the Penguins can resign Sutter for $3MM or less, and pair him with some better linemates, he could end up providing nice value at the third line center position. If he wants much more than $3MM, the Penguins should explore trading his RFA rights and letting another team gamble on his improvement.
Jussi Jokinen–Jokinen performed extremely well this season after being elevated from a fourth line role (and healthy scratch) in last year’s playoffs to a top six spot this year. Receiving very favorable zone starts–57.1%–and playing with Malkin for the majority of the year is a great situation, and Jokinen made the most of it, putting up a 54.8 CF% while posting the second highest point and goal totals of his career. With (at least) one open spot in the top six, the Penguins should explore bringing Jokinen back for somewhere around the $3MM total he made last season. Jokinen is an interesting case given the hiring of Jim Rutherford, who ate salary to trade him to the Penguins for a late round pick at last year’s deadline. Will Rutherford be willing to consider bringing Jokinen back, or does he still carry whatever opinion of Jokinen led to last year’s trade?
Marcel Goc–When Goc was acquired at the trade deadline this season it was applauded as a strong depth move by the analytics community. While he has never been a strong point producer, Goc has made a career out of taking tough zone starts and matchups while producing solid possession numbers. While he battled injuries and struggled during his time with the Penguins this year (see this article), his past numbers and reputation are enough to warrant consideration as a bottom six option for next season. In addition, at 30 years old Goc shouldn’t be a risk to decline substantially in the next few years. If he is willing to take a similar deal to his last one (3 years at $1.7MM per) he could provide a solid alternative at the third line center spot if Sutter becomes too expensive.
Lee Stempniak–The other trade deadline acquisition this season, Stempniak, was somewhat of a disappointment. During the regular season he posted unusually poor possession numbers (45.4 CF%) while producing only 11 points in 21 games despite spending over 60 percent of his ice time with Crosby. He played much better in the playoffs, posting strong possession numbers (54.5 CF%), but the points didn’t come due to a low on-ice shooting percentage. Like Goc, Stempniak is a player with a history of being effective from a possession perspective without producing significant offense (that one outlier 27 goal season with St. Louis aside). At 31 Stempniak wouldn’t be a bad option as a third line winger; however, the Penguins should only pick one of Goc and Stempniak given the team’s existing commitments to forwards in their mid 30s.
Brian Gibbons–Retaining Gibbons should be management’s easiest decision. After being called up mid-season Gibbons was an effective emergency fill in on the top line before settling into a more fitting role as a third line winger. Gibbons posted a 51 CF% and a 3.3 CF Rel% in 41 games, and while he benefited from a significant amount of time with Crosby this season, his most common linemate was Brandon Sutter. Gibbons has shown enough to suggest that he can be an effective third line winger; however, his lack of offensive production and NHL experience should keep him affordable for the Penguins. At 26 Gibbons should be an effective player for a number of years, offering management the ability to trade term for cap hit if he draws interest from other teams. Unless Gibbons has a shockingly strong market there is no reason for him to play anywhere other than Pittsburgh next season.
Joe Vitale, Taylor Pyatt, Tanner Glass–I’m grouping these three together because they are essentially the same caliber of player. Interchangeable, ineffective fourth liners. Vitale was the best possession player of the group with an unimpressive 44.3 CF%. If the Penguins front office feels a need to bring one of these guys back it should be Vitale–he is the youngest, fastest, and least awful–but ideally they upgrade the bottom of the roster in free agency. Given how bad the fourth line was this season that shouldn’t be a difficult task.
Defensemen–1 RFA, 3 UFA
Simon Despres(RFA)–Despres had his NHL opportunity this season delayed by the emergence of Olli Maatta; however, a series of defensive injuries gave Despres a 34 game trial this season. Despres performed the same way he has each of the past two seasons: strong possession numbers (51.9 CF%, 6.3 CF Rel%) while playing sheltered minutes. He has been criticized for mental miscues and turnovers; however, they haven’t shown up in his possession or goal numbers to date. Another disappointment for Despres was his lack of point production–only 5 assists in 34 games–despite displaying strong puck skills. Overall Despres has played well enough in parts of three seasons in the NHL to deserve a spot on the blueline next season (he should have had Scuderi’s spot this year), and it would be shocking if the Penguins don’t resign him as an RFA. At 22 years old Despres hasn’t reached his prime yet, and it isn’t unreasonable to expect him to improve over the next several seasons.
Matt Niskanen–I already addressed Niskanen in some detail here. The short version is that while he is an effective player he is going to be one of, if not the most, sought after free agents on the market this year. Chances are he will be priced well beyond what the Penguins will or should spend on him.
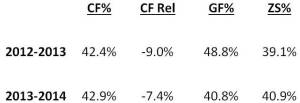
Brooks Orpik–Orpik has been a fan favorite during his career, known for big hits and strong work in his own zone. However, Orpik’s play has slipped over the past few seasons:
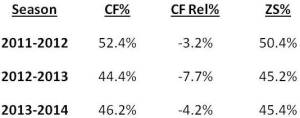
*Data from ExtraSkater.com
The Penguins have been heavily outpossessed with Orpik on the ice over the last two seasons, despite spending a significant portion of his ice time with Paul Martin. While frequently starting the defensive zone and tough competition play a role in Orpik’s poor results, looking at how players have performed with and without him on the ice shows that he has been holding the team back. Of players who spent over 100 minutes with Orpik over the past two seasons only one, Robert Bortuzzo, has a better CF% with him than without. While WOWY analysis has several faults, such as not accounting for QoC/QoT differences when the players are apart, sample size issues, etc., when the results across a team are this overwhelming skewed against a player it is a good indicator that they aren’t effective. While there is a chance Orpik could still be a passable defenseman outside of a top pairing shutdown role, the Penguins should move on and see if a team that focuses on grit, such as Toronto, is interested in trading for his rights prior to free agency.
Derek Engelland–Engelland has been adequate in his role as a 6th/7th defenseman with the flexibility to occasionally play forward, but he shouldn’t be mistaken for an effective regular defenseman. Despite seeing easy zone starts and competition in 2011/2012 and 2012/2013 Engelland posted negative 3.4 and negative 1.8 CF Rel%, respectively. This season he saw significantly tougher zone starts, and predictably his numbers took a nosedive to a 43.8 CF%, good for a negative 5.2 CF Rel%. While his versatility is useful, the Penguins have no reason to retain Engelland for the upcoming season. Engelland is 32 and the Penguins have plenty of young depth options in WIlkes-Barre if they need a third paring fill in. I would expect Engelland to leave for a team willing to give him a regular spot (Edmonton has been rumored to be interested) and the Penguins will go in another direction, either promoting a prospect from within or signing a more effective bottom pairing option.